- SportsVisio Lens
- Posts
- 6,117 shots. 68 teams. $932M in NIL. Here's what we found
6,117 shots. 68 teams. $932M in NIL. Here's what we found
Lens 41: Did the Big Ten bought the tournament. We'll see.
Sean O'Connor
March 26, 2026
Does Money Buy March?
College basketball teams spent $932 million on NIL this season (per Opendorse). Every program in the field loaded up through the transfer portal, stacked rosters, and aimed for a deep run.
So does the investment pay off?
We mapped every team's total program cost (estimated operating budget + estimated NIL) against their tournament seed. Full-color logos are still dancing. Grey ghosts went home.
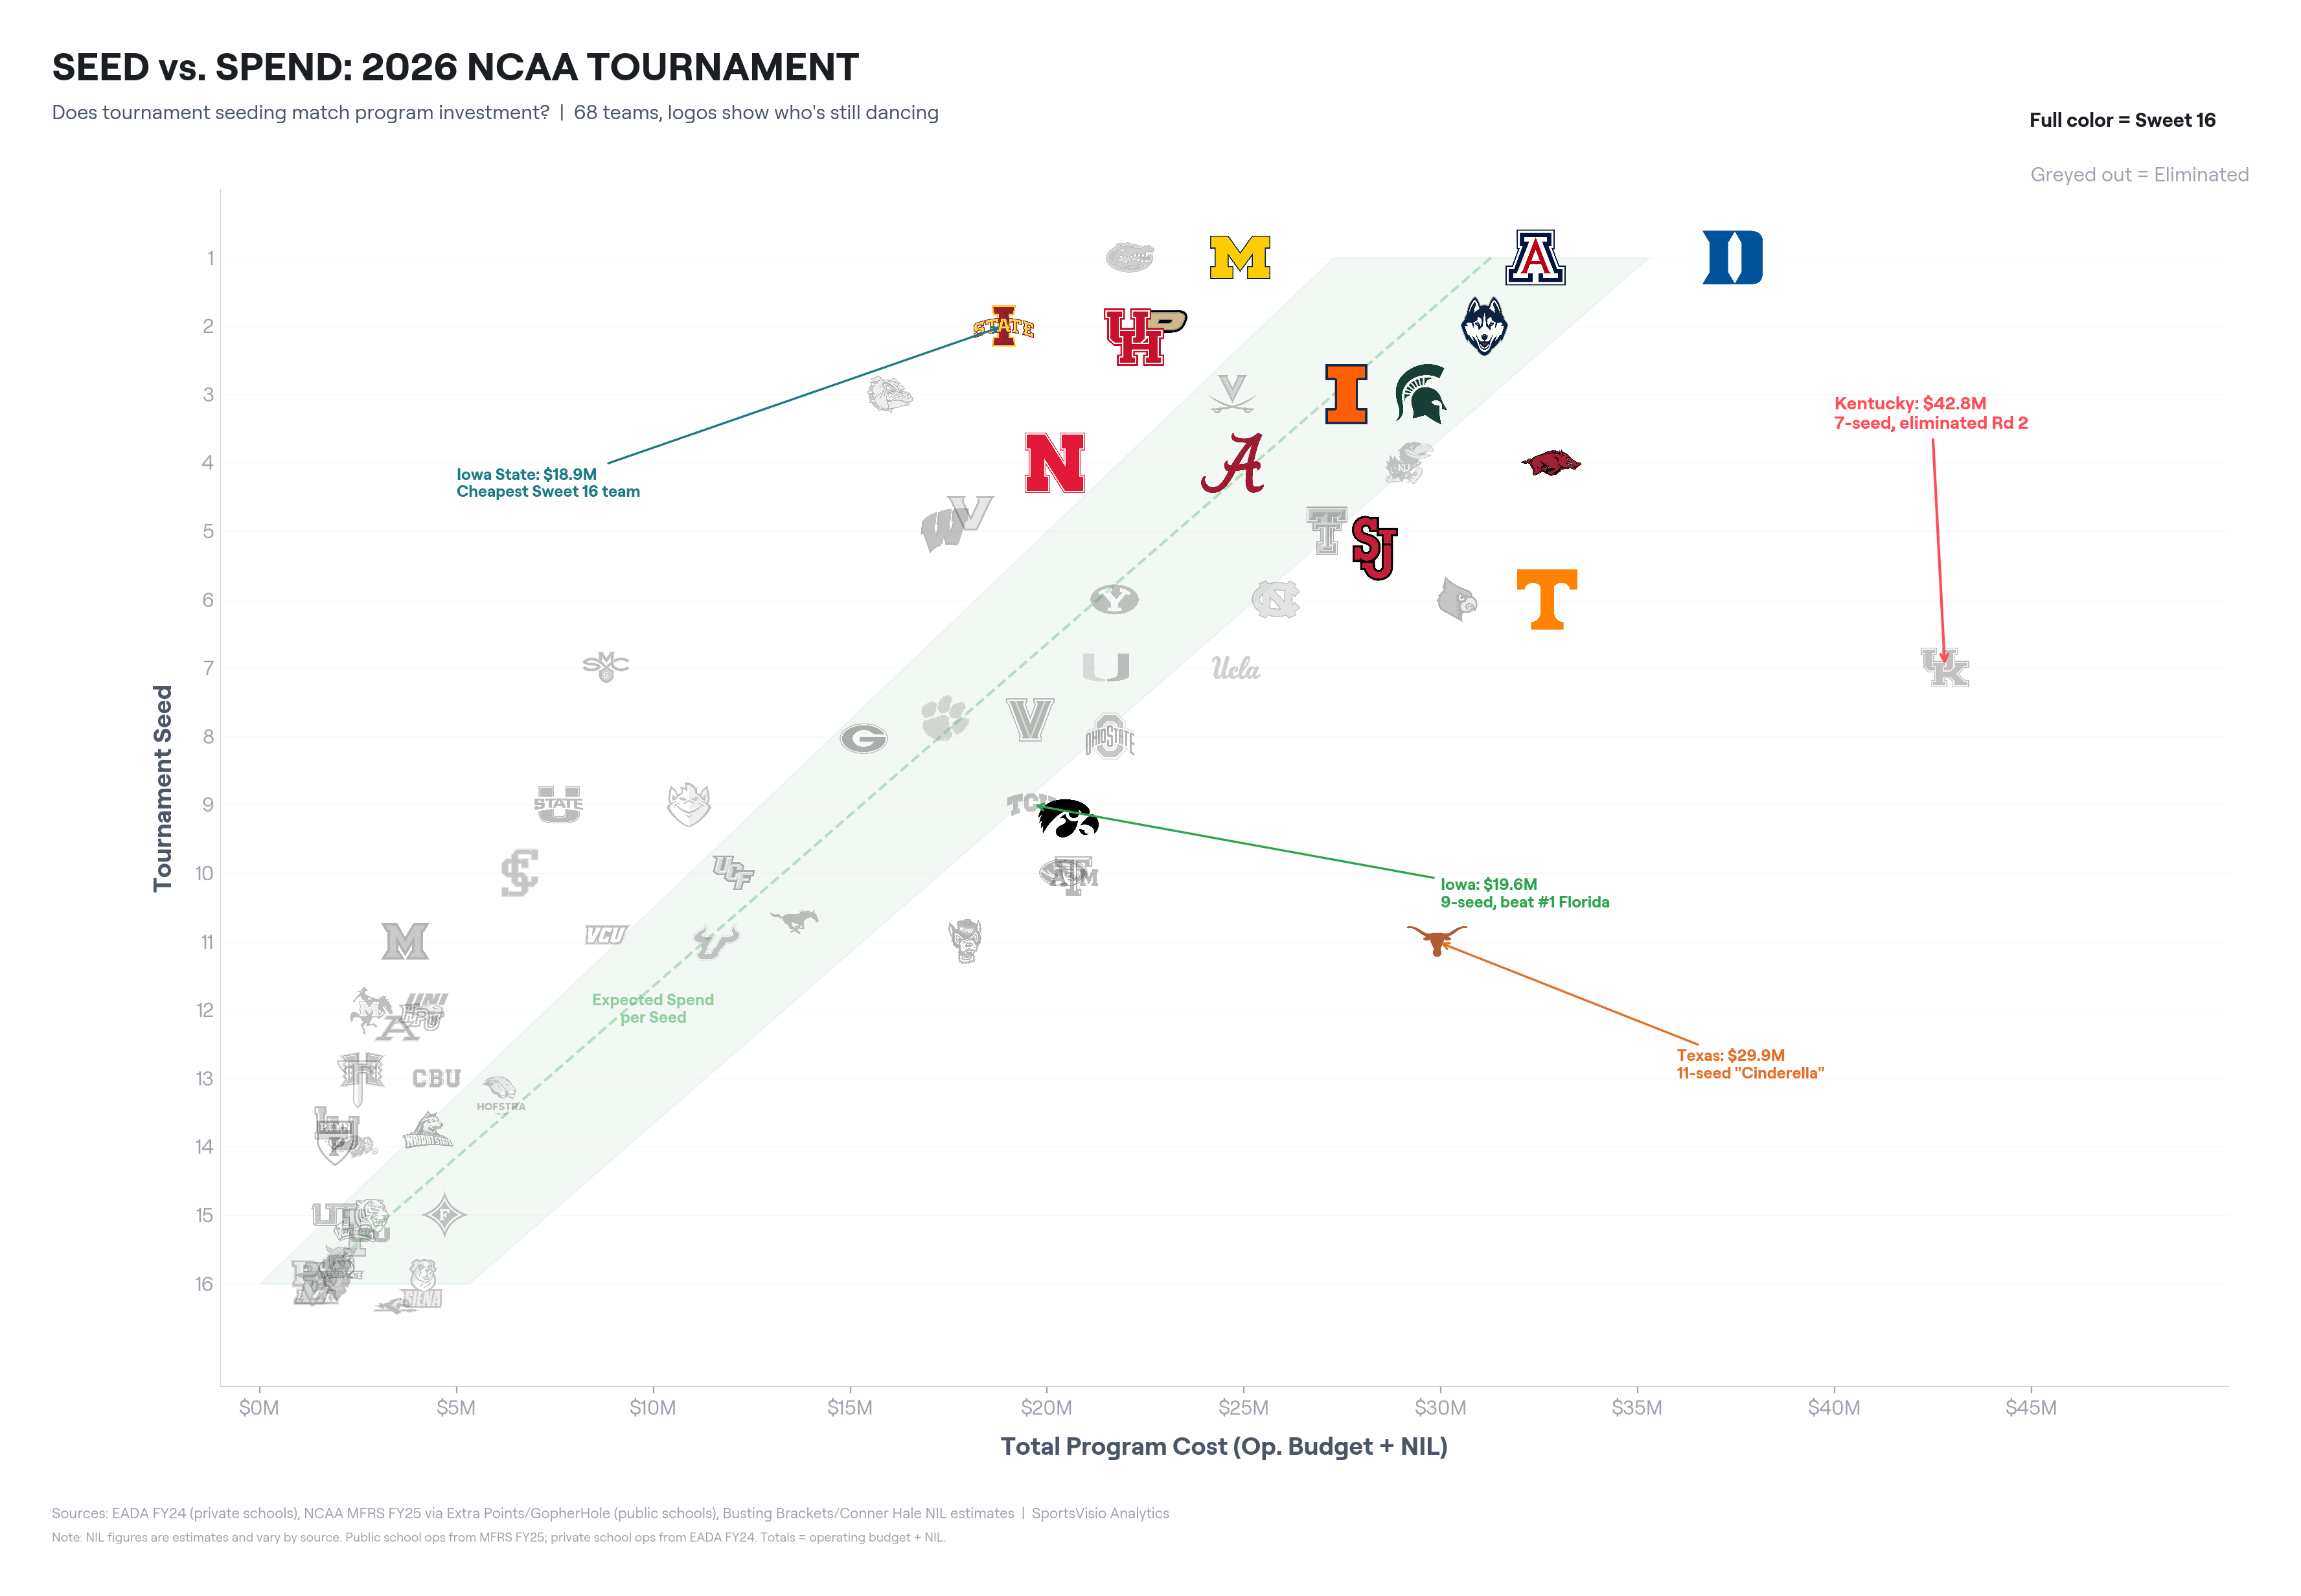
What jumps out:
Kentucky spent A LOT as a 7-seed. Gone in Round 2. The most expensive roster in the sport didn't survive the first weekend.
Texas is a big-money, blue-blooded "Cinderella." They're an 11-seed spending like a 1-seed. The play-in-to-Sweet-16 story writes itself, but the budget tells you this isn't exactly Cinderella.
Iowa State is the cheapest team still alive, and they're a 2-seed. Proof that coaching and culture still matter.
Iowa beat defending champion Florida as a 9-seed. Florida spent a bit more and won it all last year. Iowa is winning with their “toughness” mentality.
The green trend line shows what you'd expect: higher seeds generally spend more, but also that the top 6 seeds don’t have a bunch of correlation between spend and seed.
March doesn't care about your budget. It cares about 40 minutes.
6,117 Shots. One Court.
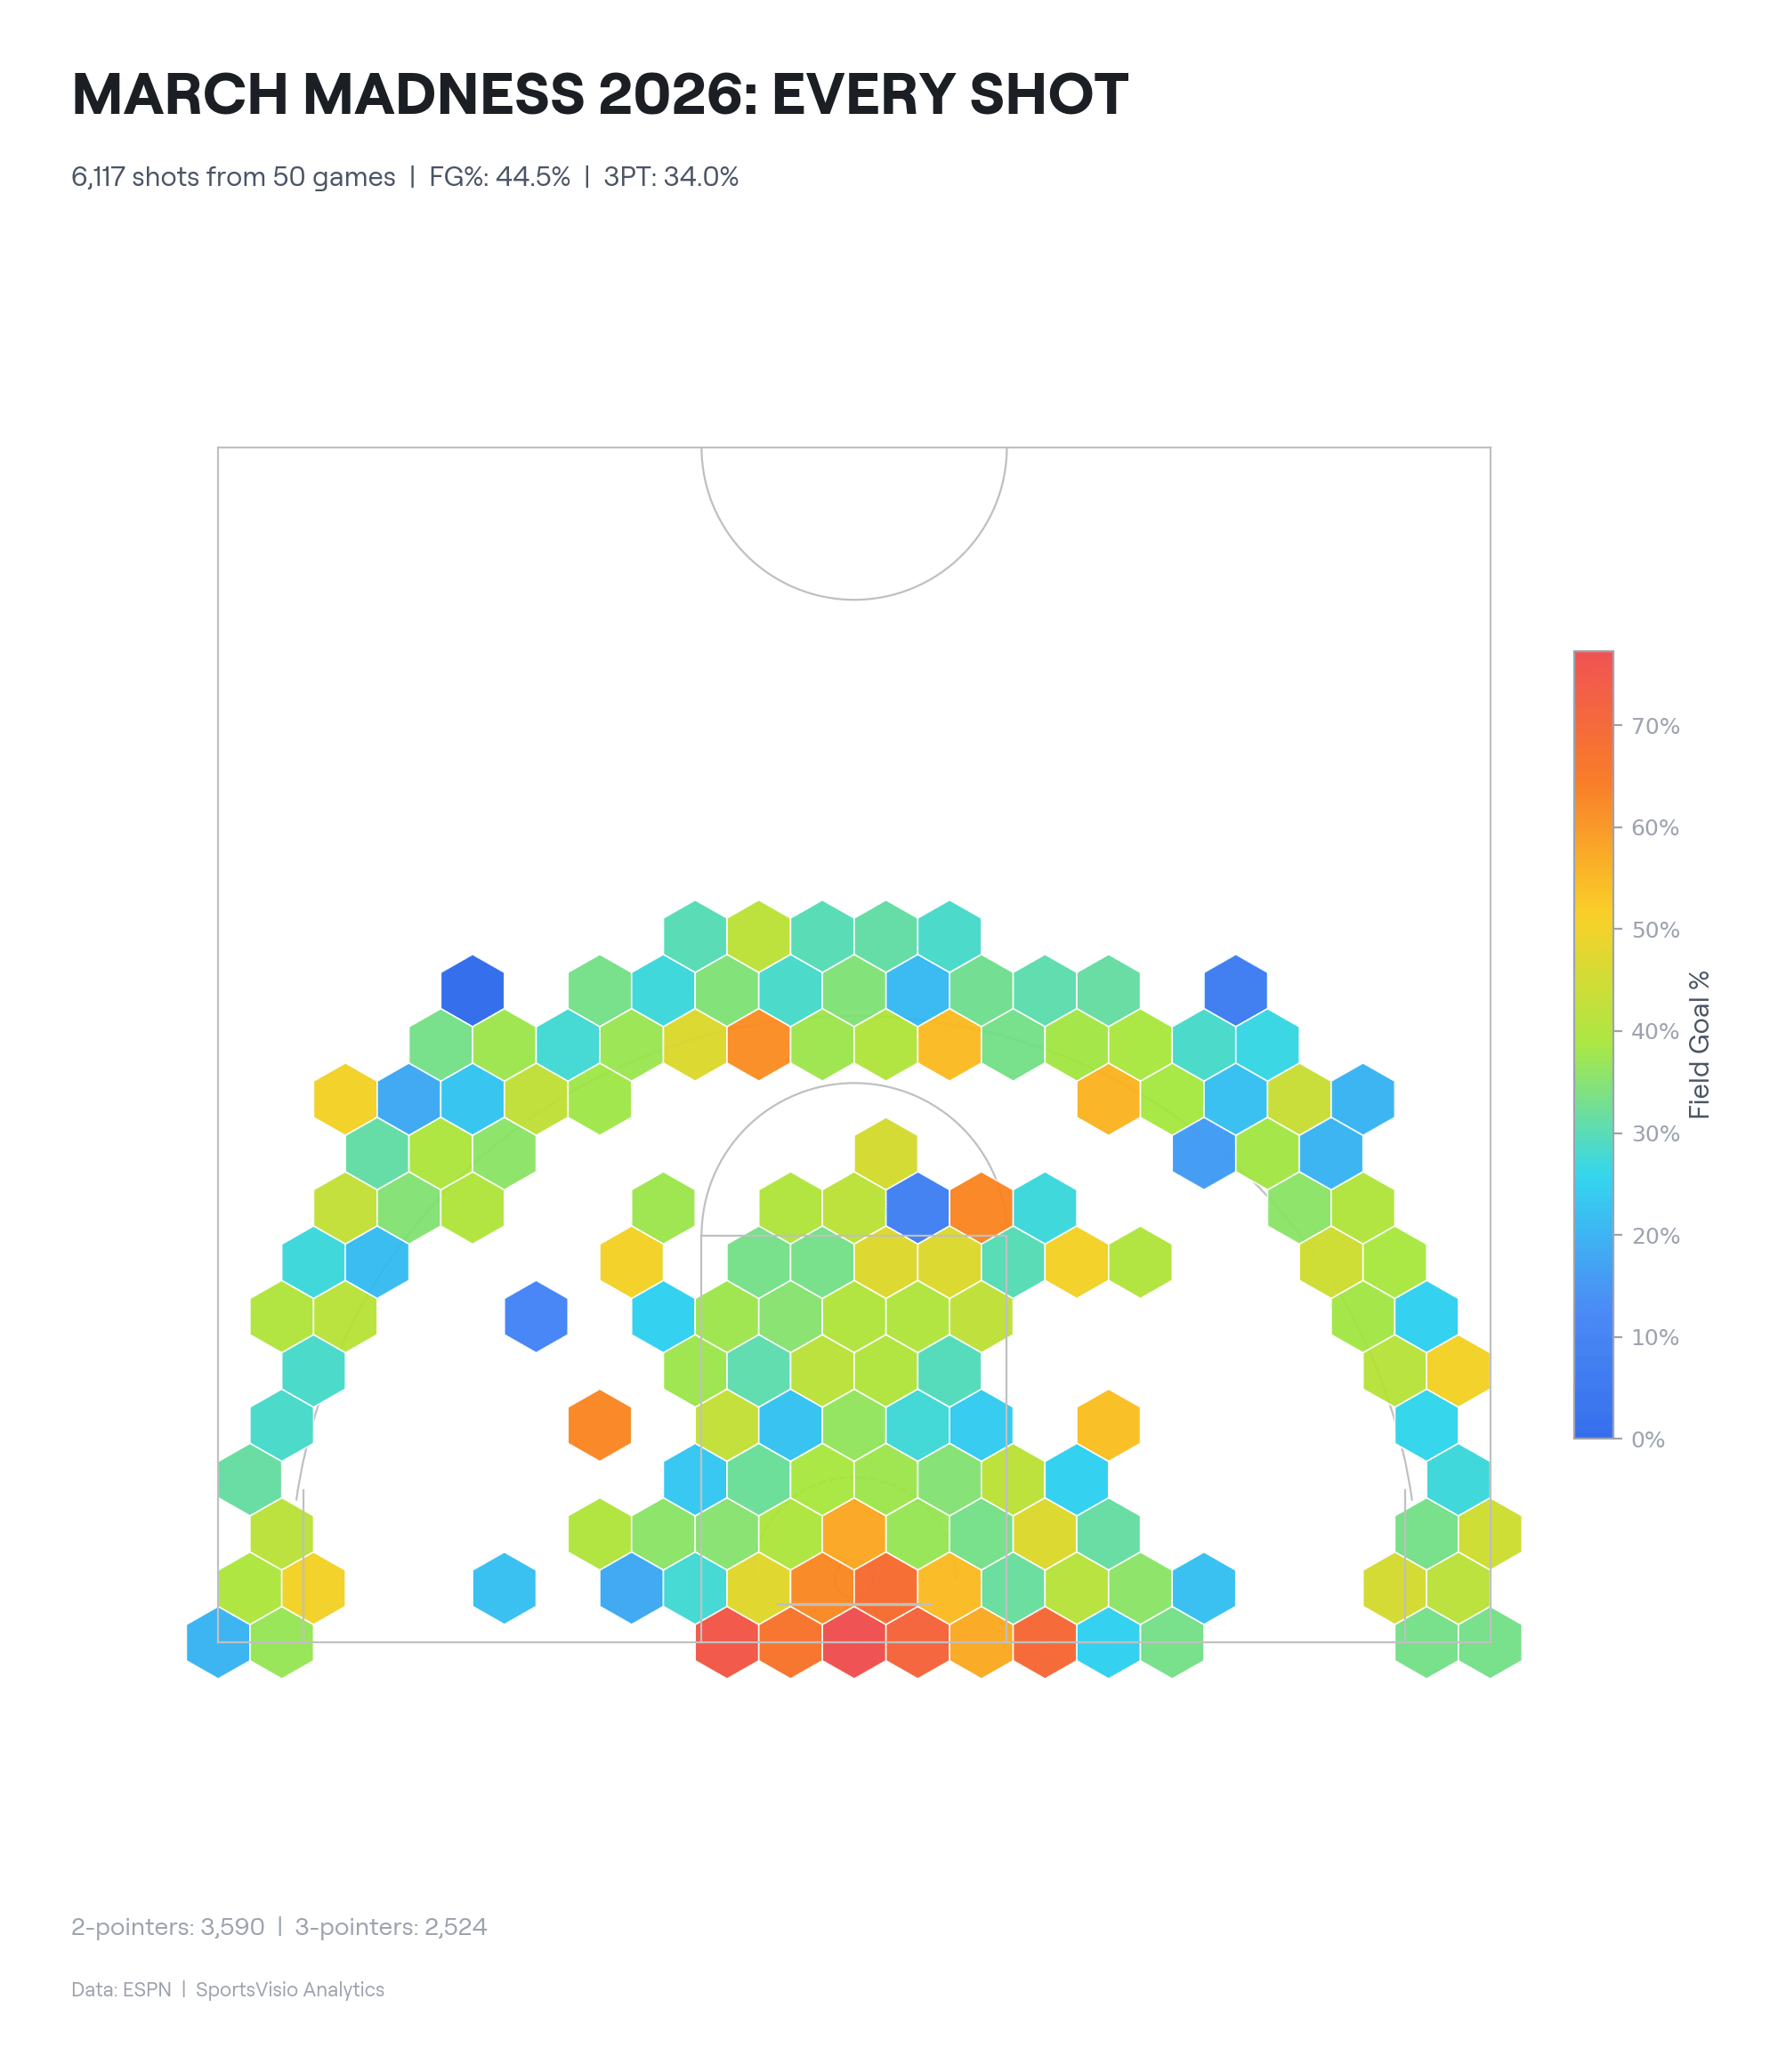
We pulled every shot from every game in the 2026 NCAA Tournament and mapped them on one half-court.
The numbers:
6,117 total shots across 50 games
44.5% overall FG% (tournament basketball is hard)
34.0% from three — cooler shooting in win-or-go-home games
3,590 two-pointers, 2,524 three-pointers — nearly 40% of all shots come from beyond the arc
What the heat map shows:
The paint is where money is made. You can see the highest FG% zones (red/orange hexes) concentrated around the rim. The mid-range is a wasteland of blue and green hexes. And the three-point line? It's a rainbow where volume is high, and efficiency varies wildly.
Corner threes (bottom corners of the arc) light up warmer than the wings. The top of the key is where hope goes to die.
Sweet 16 Shot Signatures
We love data, and we especially love shot charts. Let’s click in a bit deeper. Every team has a fingerprint. This is what they all look like.
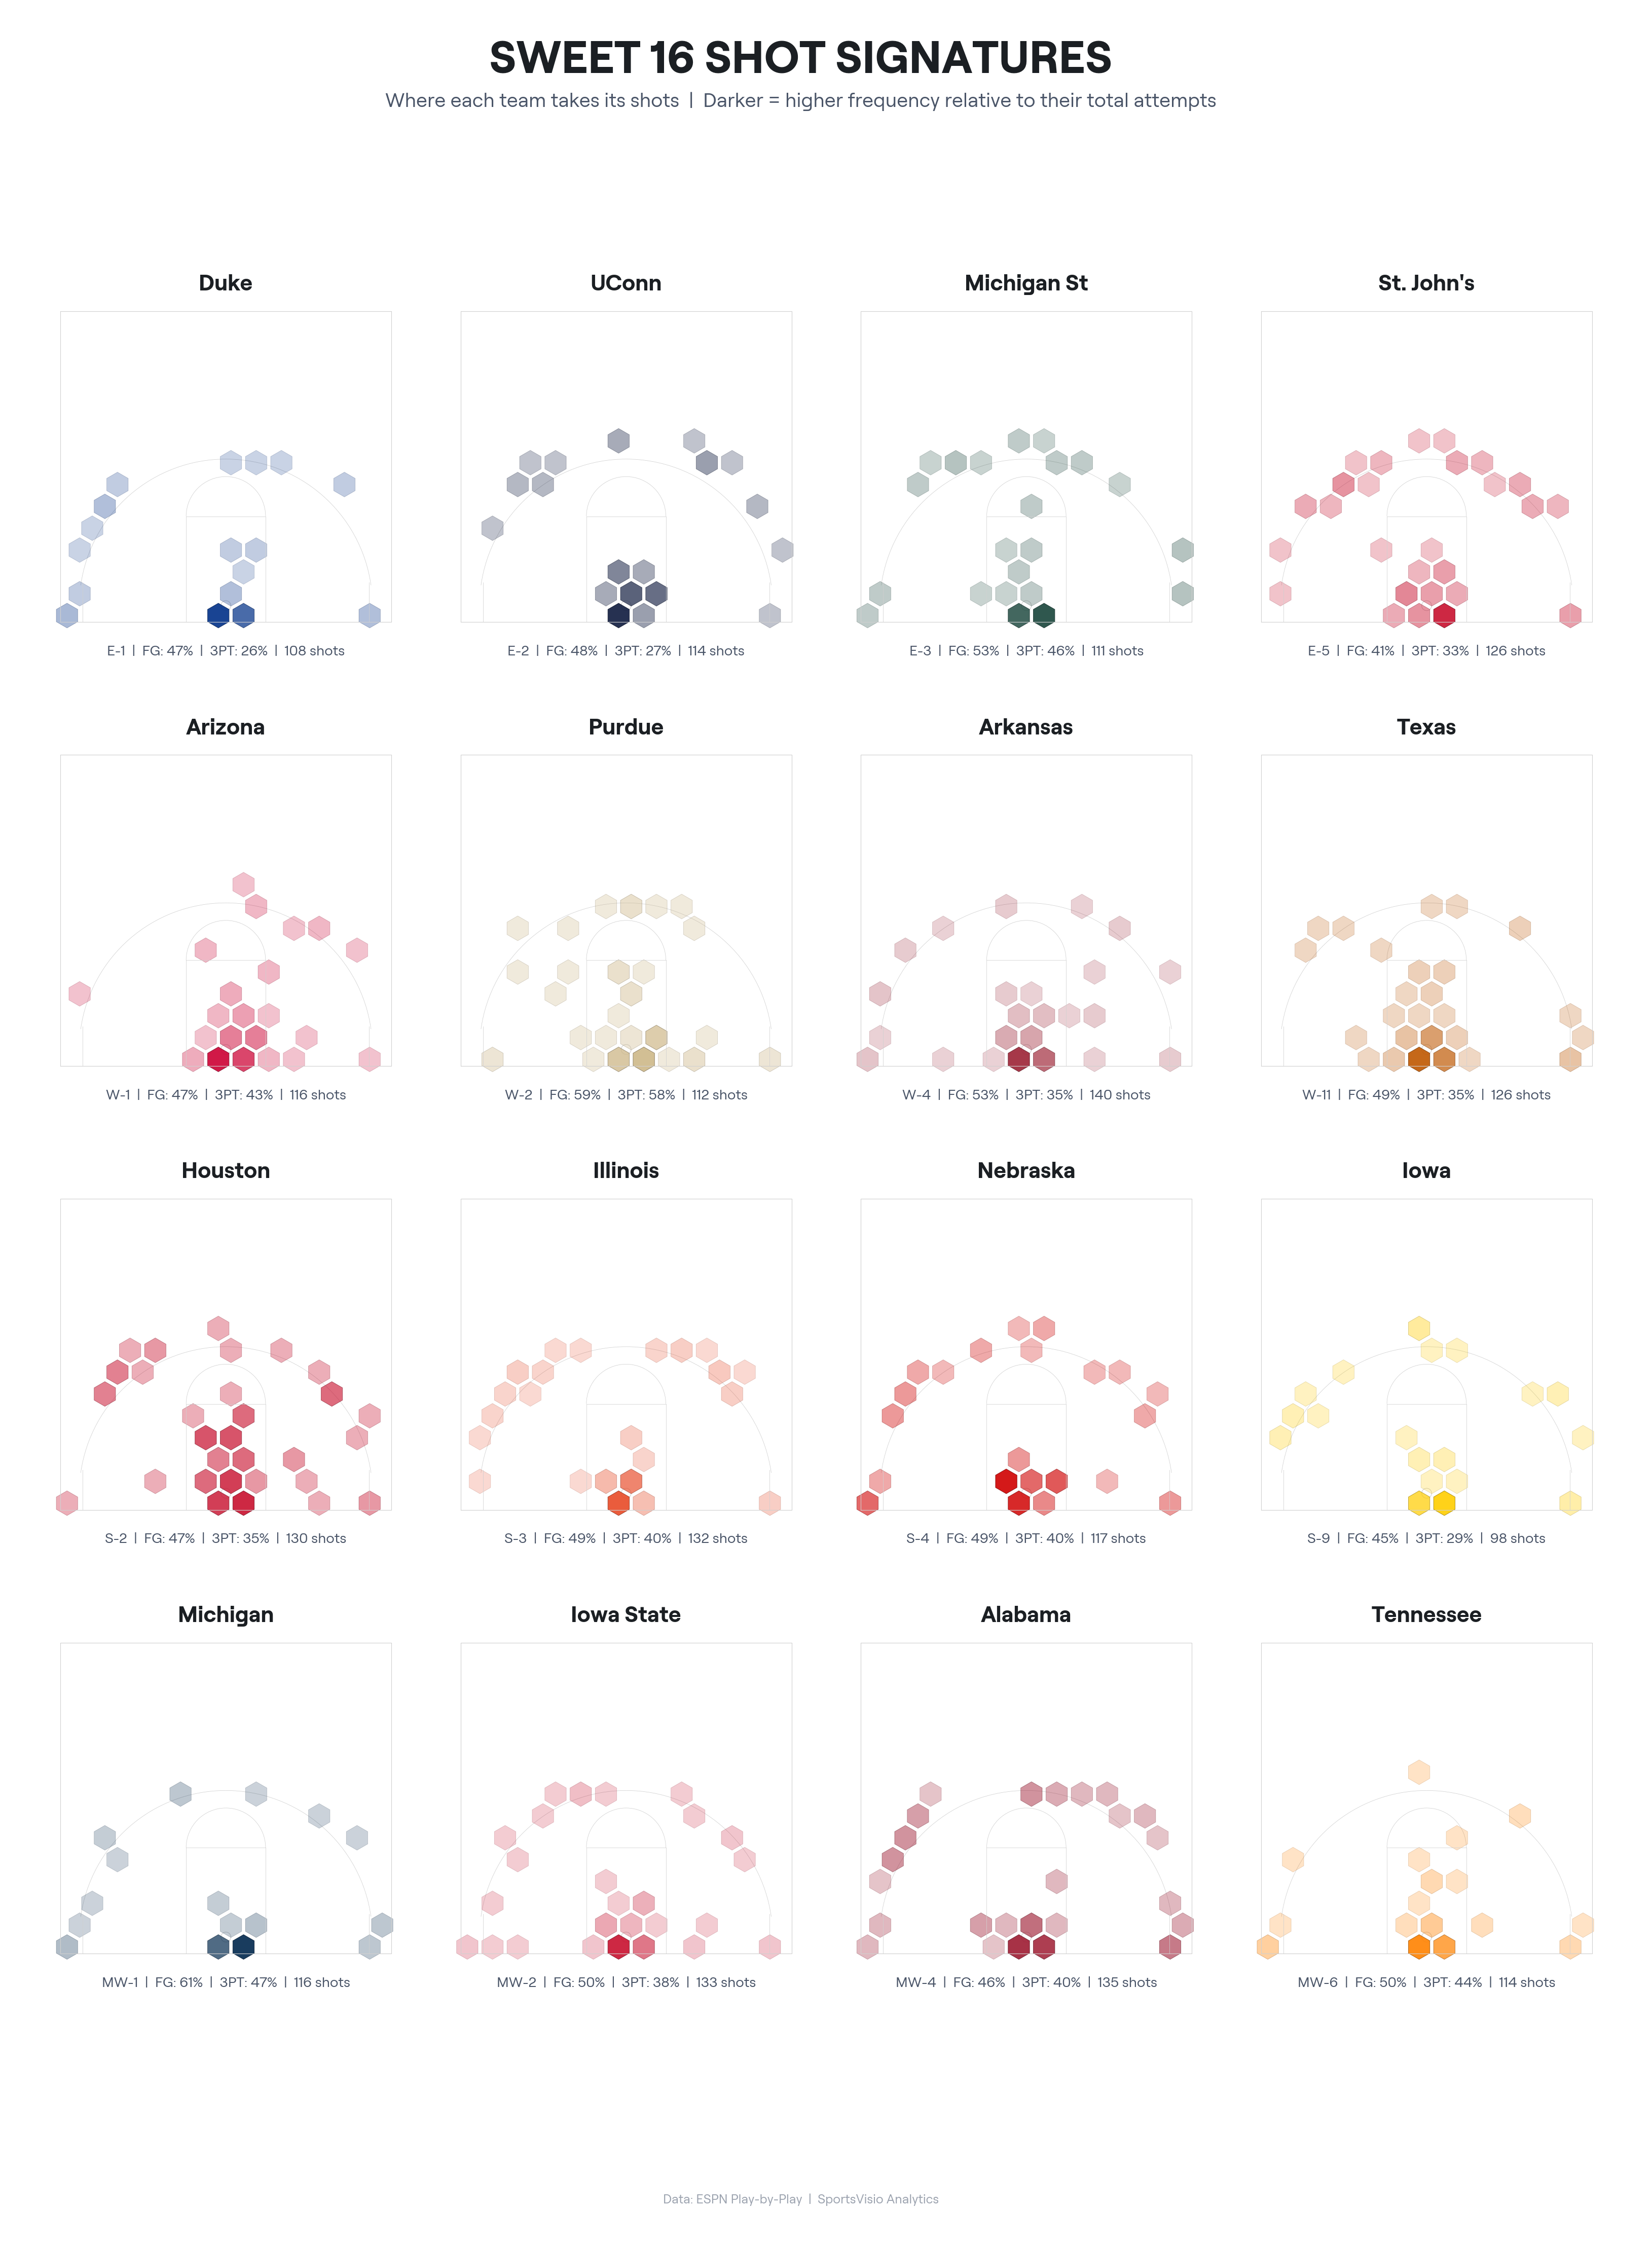
Each hex tile shows where a team takes its shots relative to their total attempts. Darker hexes = more shots from that zone. Each team's primary color tells you who's who at a glance.
The outliers are where it gets interesting:
Michigan: 61.2% FG — the most efficient team in the tournament. They live in the paint (54% of shots) and barely touch the mid-range (5%). When they do shoot, they score.
Purdue: 57.9% from three. Read that again. Nearly 58% on threes across two tournament games. They're also the only Sweet 16 team that loves the mid-range (29% of shots) — and they're making those too. Old-school shot selection, very Hickory Hoosiers of them.
Alabama: 57.8% of their shots are threes. The most trigger-happy team in the field. Over half their attempts come from beyond the arc. When they're hot, nobody can keep up. When they're cold, see ya next year.
St. John's: 41.3% FG — the lowest of any Sweet 16 team. They're surviving on volume and defense, not efficiency. Over half their shots are threes (50.8%) at a mediocre 32.8% clip. They're one cold half from going home.
Arkansas: The paint bully. 56% of shots within 8 feet of the rim, only 26% from three. They're winning the way your high school coach wanted you to play — get to the basket, finish, repeat.
Duke: The tale of two Dukes. Elite inside at 63.9% on twos — but ice cold from three at 25.5%. If their opponents pack the paint, Duke has a problem. They were lucky to get past Siena.
The tournament average is 44.5% FG and 34.0% from three. Six teams are shooting above 49% overall. That's your Final Four shortlist.
When a team's signature matches their opponent's weakness, that's where upsets happen.
See Every Shot in Your Games, Too
SportsVisio turns any camera into a stats machine. Box scores, shot charts, per-player highlights — all generated automatically from your game footage.
No special cameras. No stat crews. No manual entry.
Record the game. We do the rest.
Conference Scoreboard
The Big Ten sent 9 teams. 6 are still dancing. That's a 67% survival rate — best of any major conference.
For context: the SEC sent 10 teams (the most of any conference) and 4 are through to this weekend. The Big 12 sent 8, kept 3. The ACC sent 8 and is down to just Duke. The Big East quietly sent only 3 teams and kept 2 — UConn and St. John's.
This isn't just a good tournament for the Big Ten — it's conference dominance. Michigan, Iowa, Purdue, Michigan State, Nebraska, and Illinois are all alive.
Tonight's Sweet 16 slate is practically a Big Ten invitational:
Texas v Purdue
Iowa v Nebraska
Arkansas v Arizona
Illinois V Houston
And here are the Friday matchups:
St Johns’s v Duke
Alabama v Michigan
Michigan State v UConn
Tennessee vs Iowa State

Are The Sonics Coming Home?
In non-March-Madness basketball news: the NBA Board of Governors officially voted to explore expansion to Seattle and Las Vegas.
Translation: the SuperSonics are likely coming back to Seattle. Climate Pledge Arena is ready. The city hasn't stopped wanting this since 2008.
Franchise price tag? Somewhere between $7 billion and $10 billion. That's roughly 170 Kentucky basketball programs.
Sports in the Pacific Northwest are looking up these days. The Seahawks just won the Super Bowl. Mariners are good again, and now the Sonics are coming home. Good time to be a Seattle sports fan.
Keep running, keep shooting!
Sean O'Connor
SportsVisio