- SportsVisio Lens
- Posts
- Every basketball team has one of 5 shot signatures. Which is yours?
Every basketball team has one of 5 shot signatures. Which is yours?
For Lens 42 We mapped 59,227 shots to find the 5 patterns every basketball team falls into
Sean O'Connor
April 20, 2026

Every Basketball Team Is One of Five Shot Signatures
Watch enough film, and you stop seeing plays. You start seeing patterns.
Great scouts have been able to describe opposing offenses in a sentence for as long as basketball has existed: "they live in the paint," "they shoot you out of the gym," "they're balanced and boring and they're going to beat you."
Shot charts formalize what your eyes already see.
We just pulled 59,227 shots across a full season of adult pro basketball for both men’s and women’s teams, and the pattern is consistent with everything NBA analysts have been publishing about the league for years:
Every team falls into one of five shot signatures.
Here are the Five Signatures
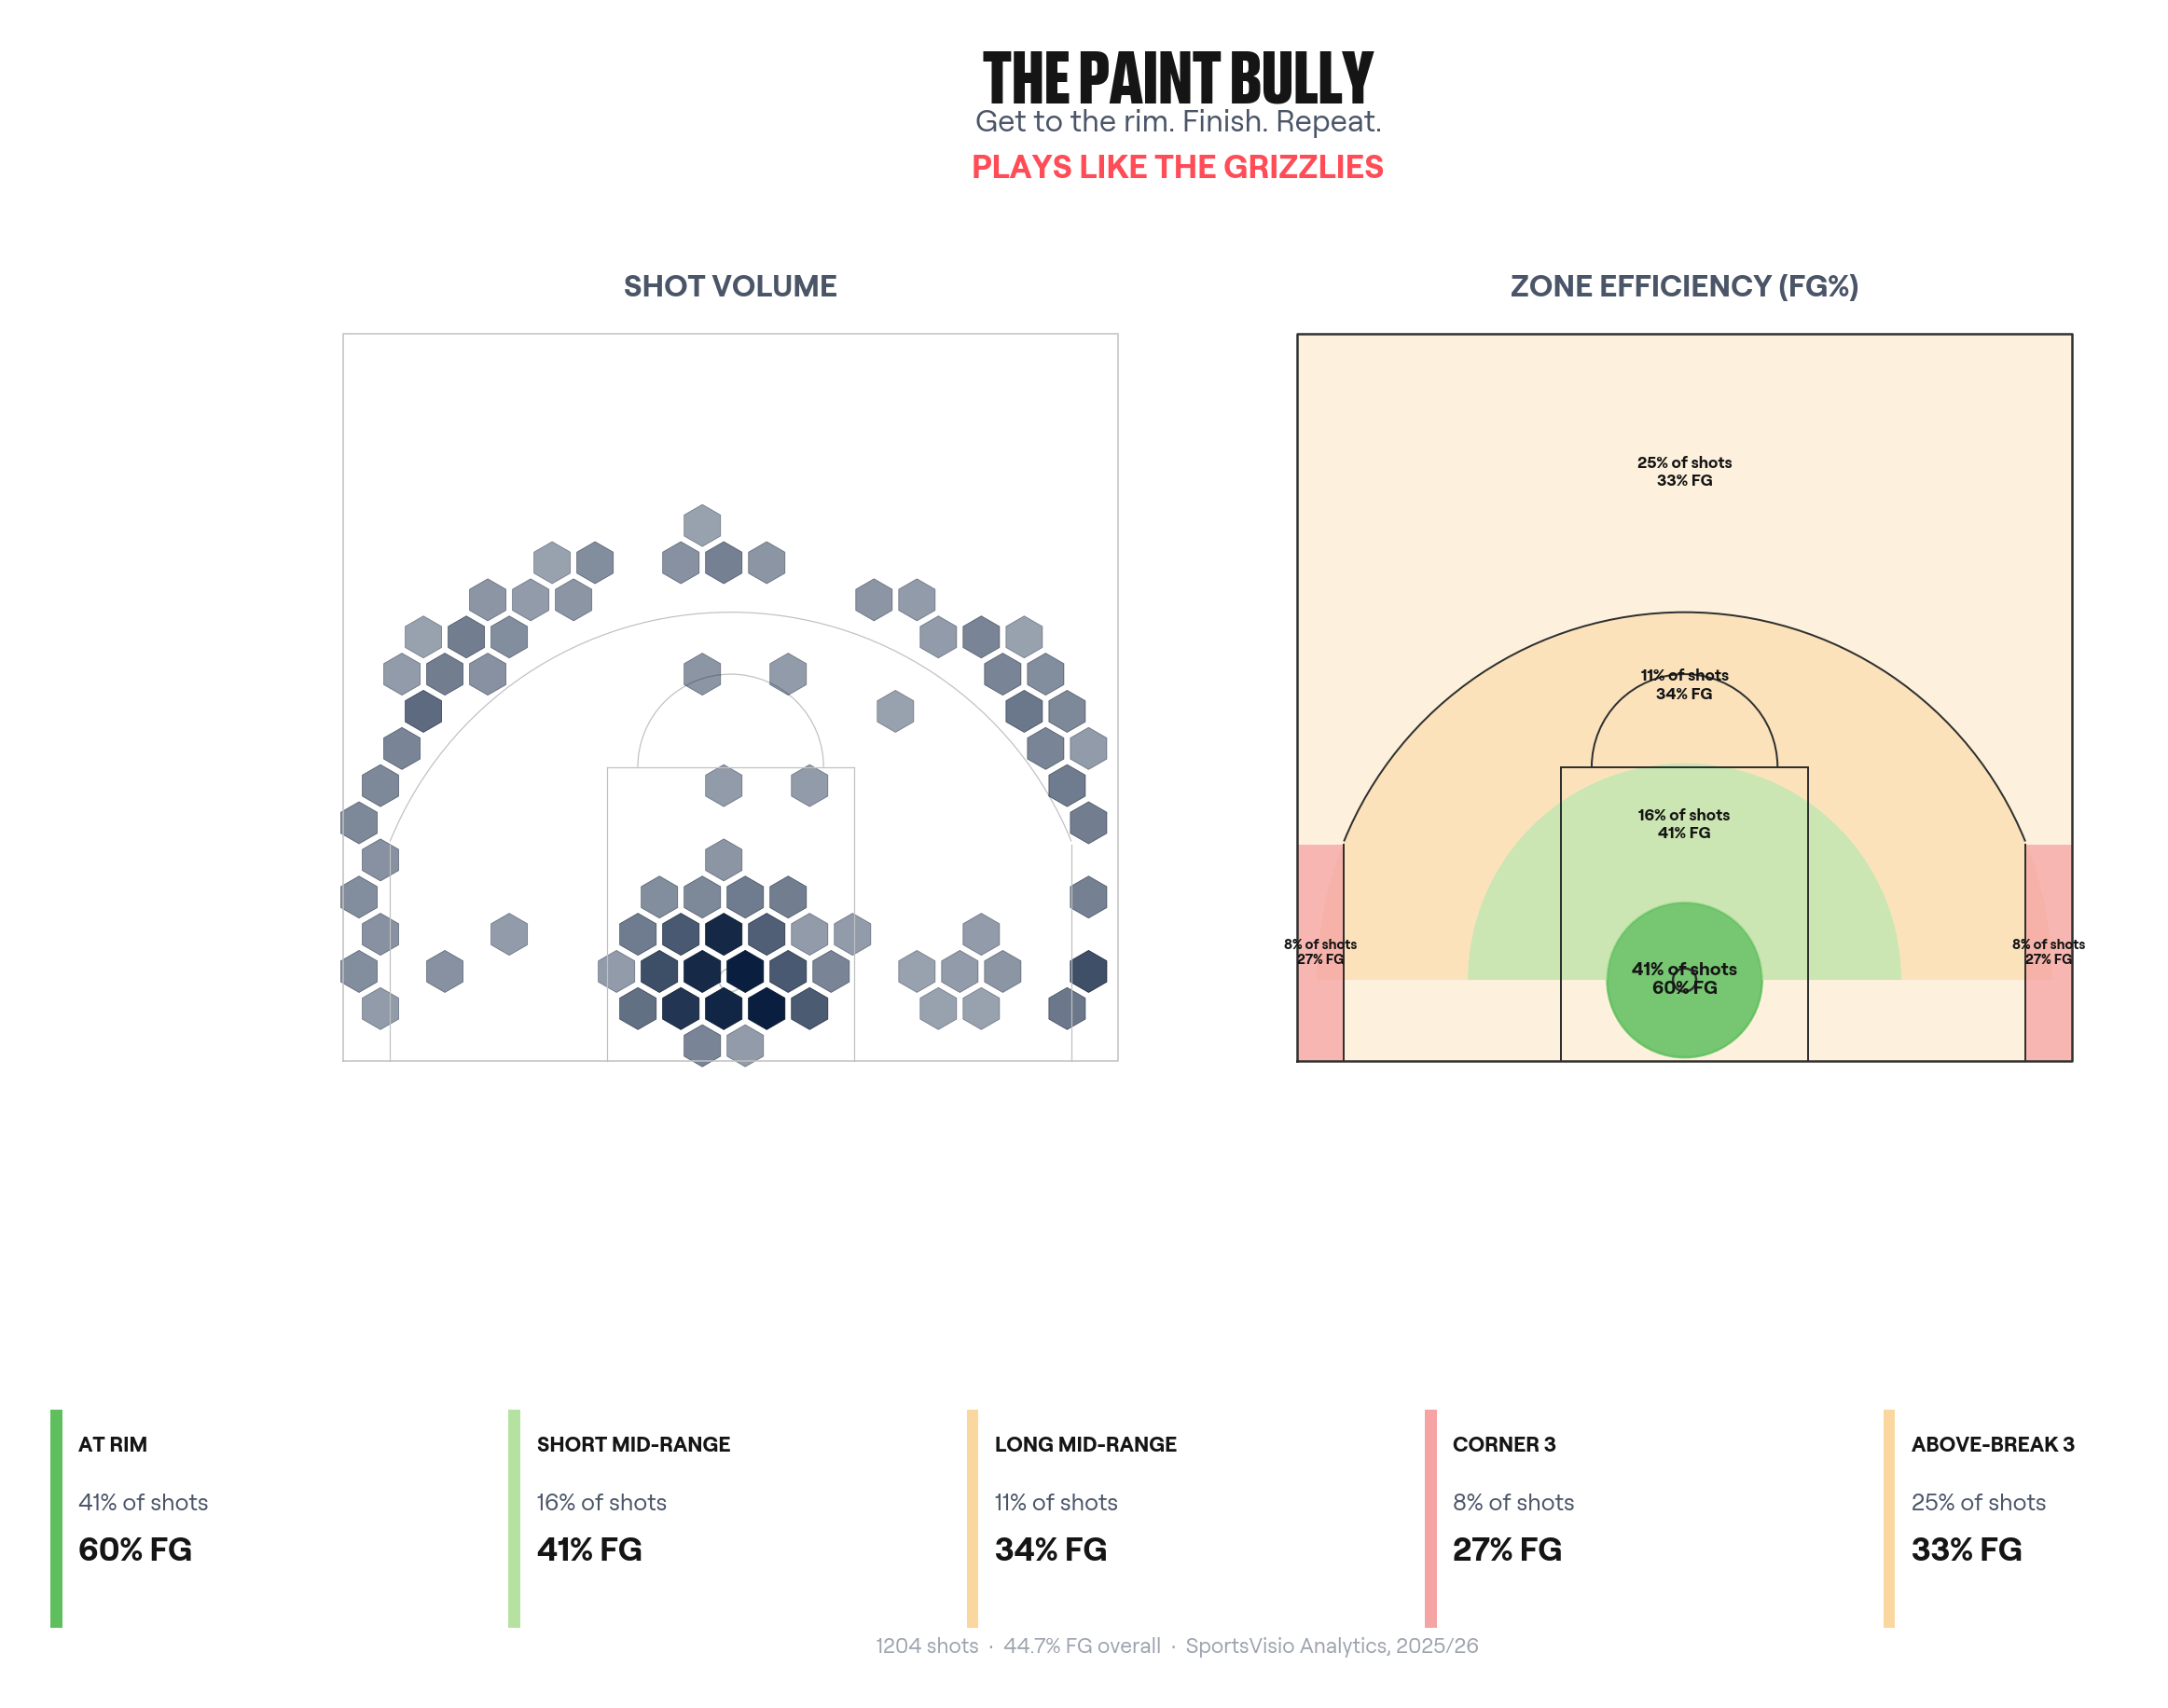
1. The Paint Bully
What it looks like: 40%+ of shots inside 10 feet. Sparse mid-range. Moderate three-point volume.
How they win: Physicality, offensive rebounds, post feeds, transition rim runs. FG% carries the day.
How they lose: When you pack the paint and force them to beat you from three, they can't.
NBA analog: Memphis Grizzlies, peak Cleveland with Mobley + Allen.
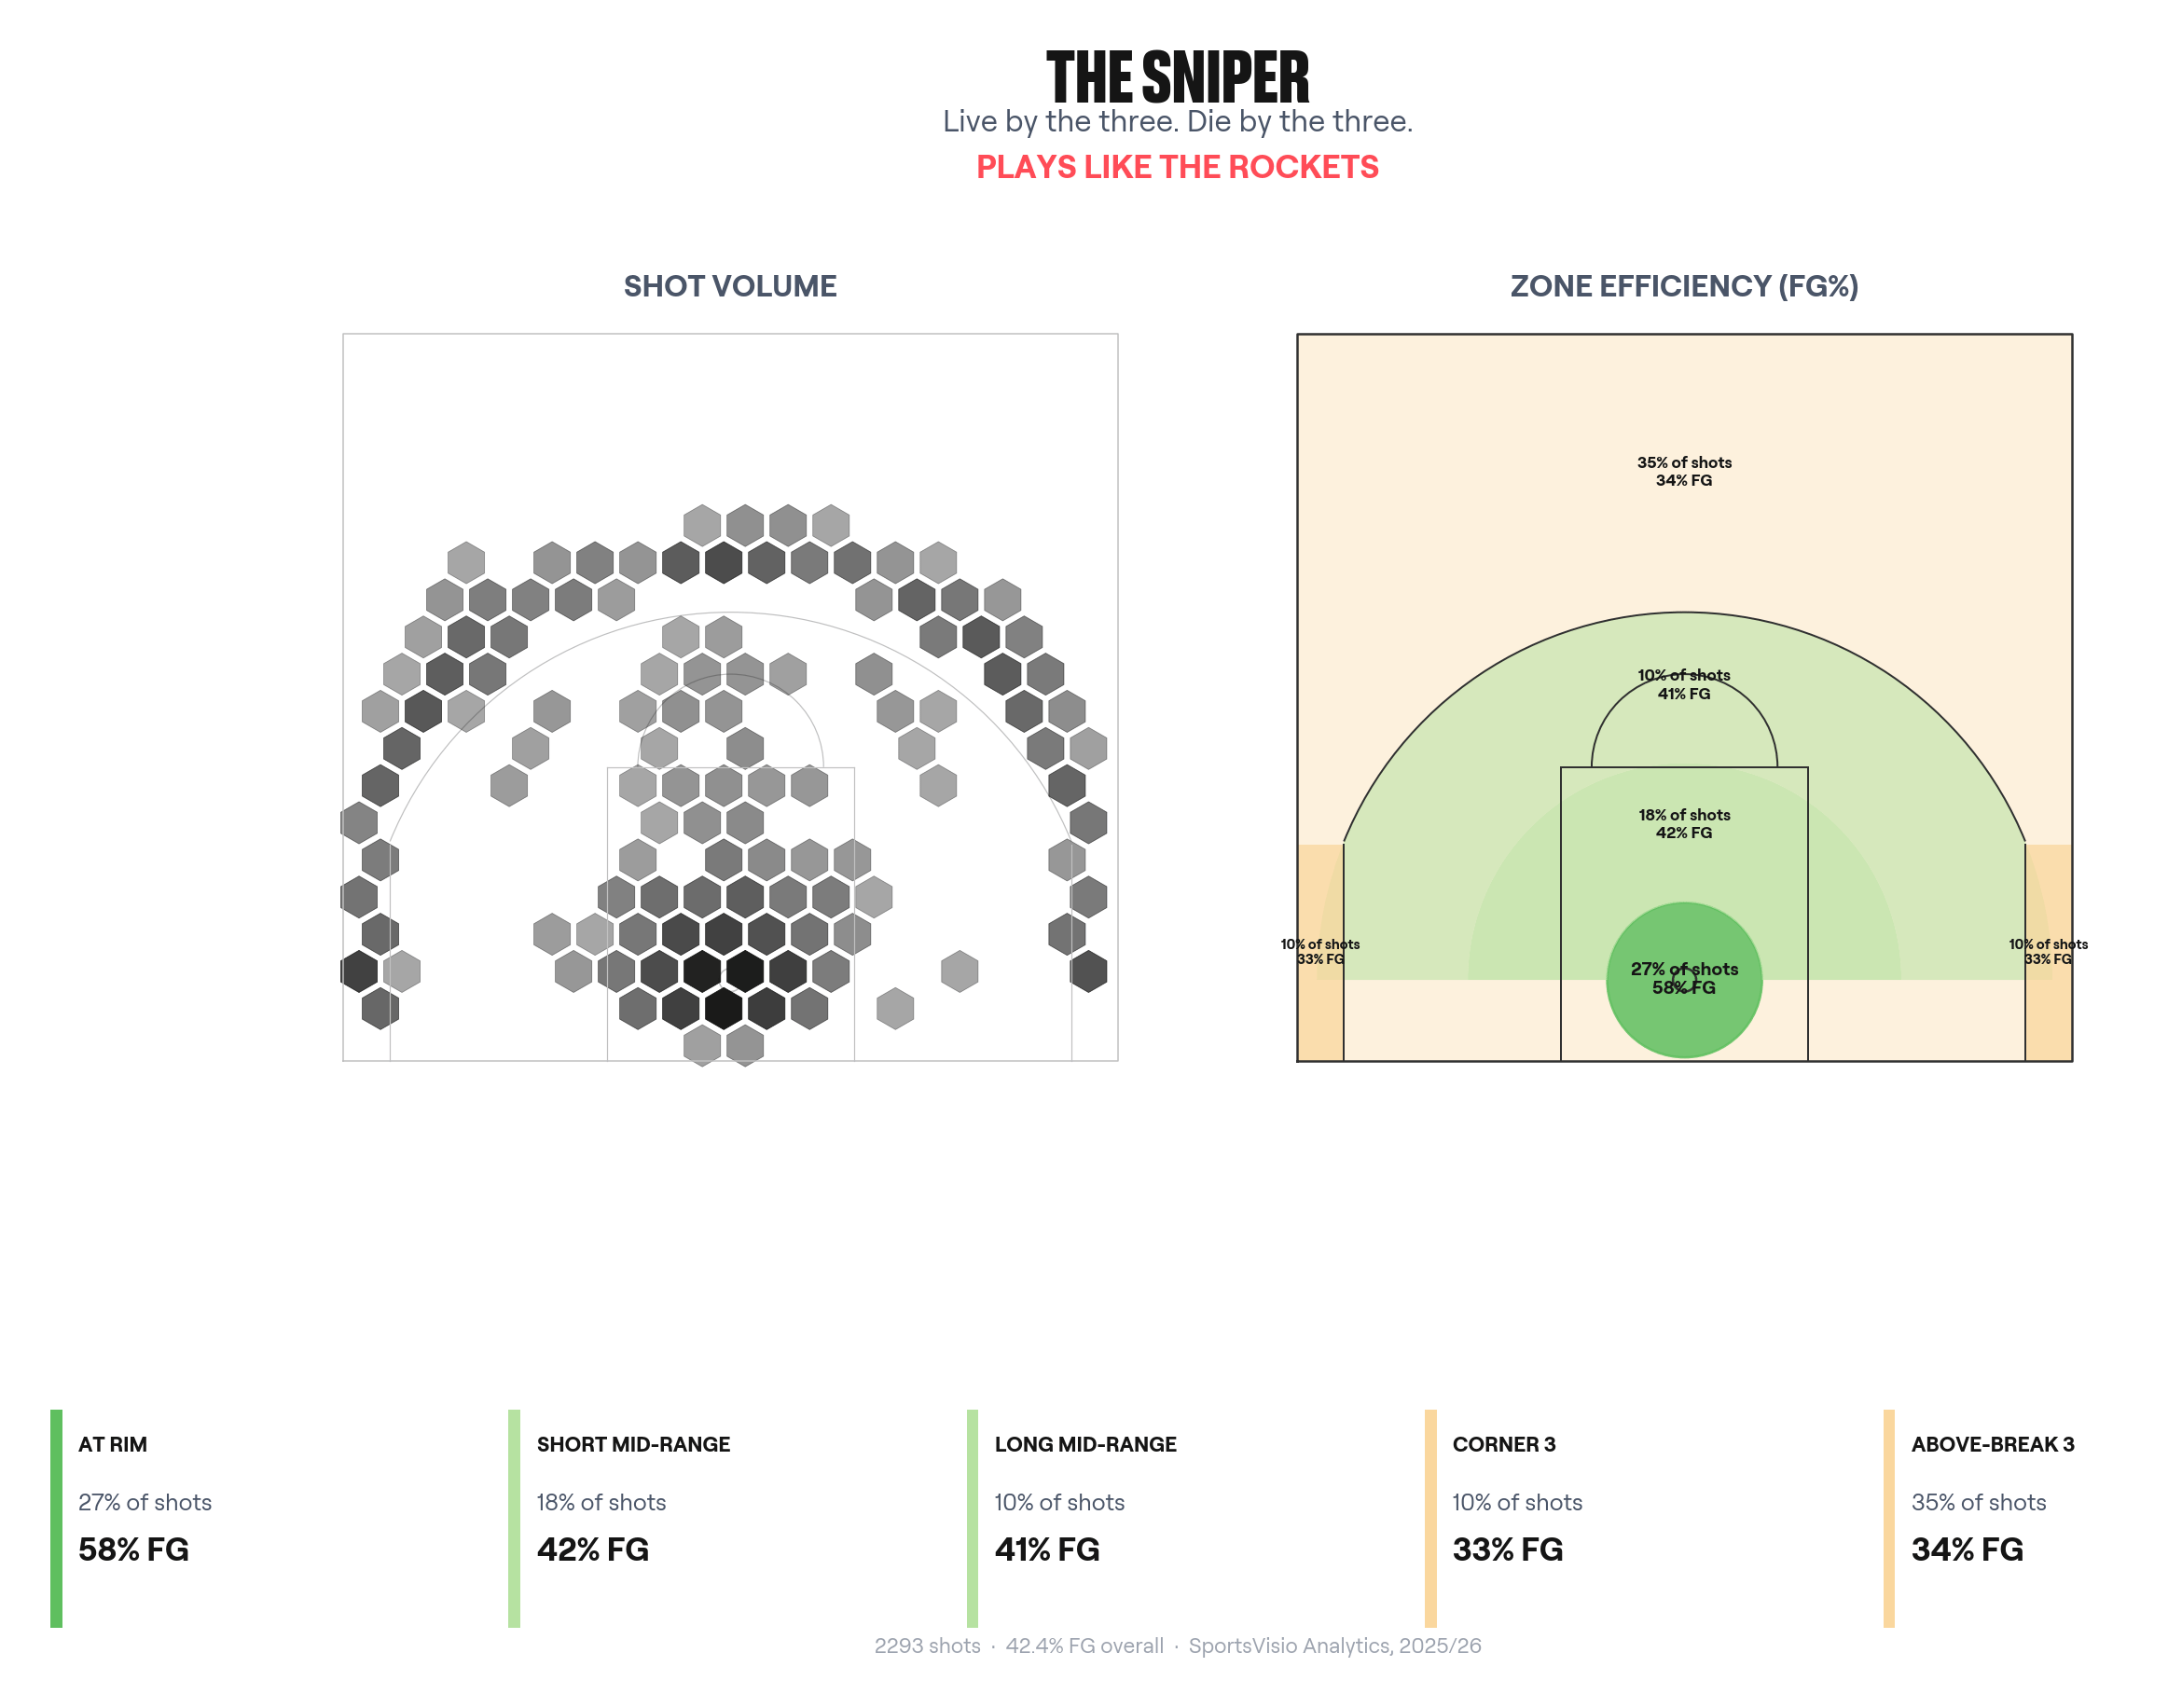
2. The Sniper
What it looks like: 40%+ of shots from three. Minimal mid-range. Moderate paint presence off drive-and-kicks.
How they win: When the shots fall, nobody keeps up. They win by a lot.
How they lose: They lose by a lot. Variance is the game.
NBA analog: 2024-25 Houston Rockets, 2019-20 Dallas.
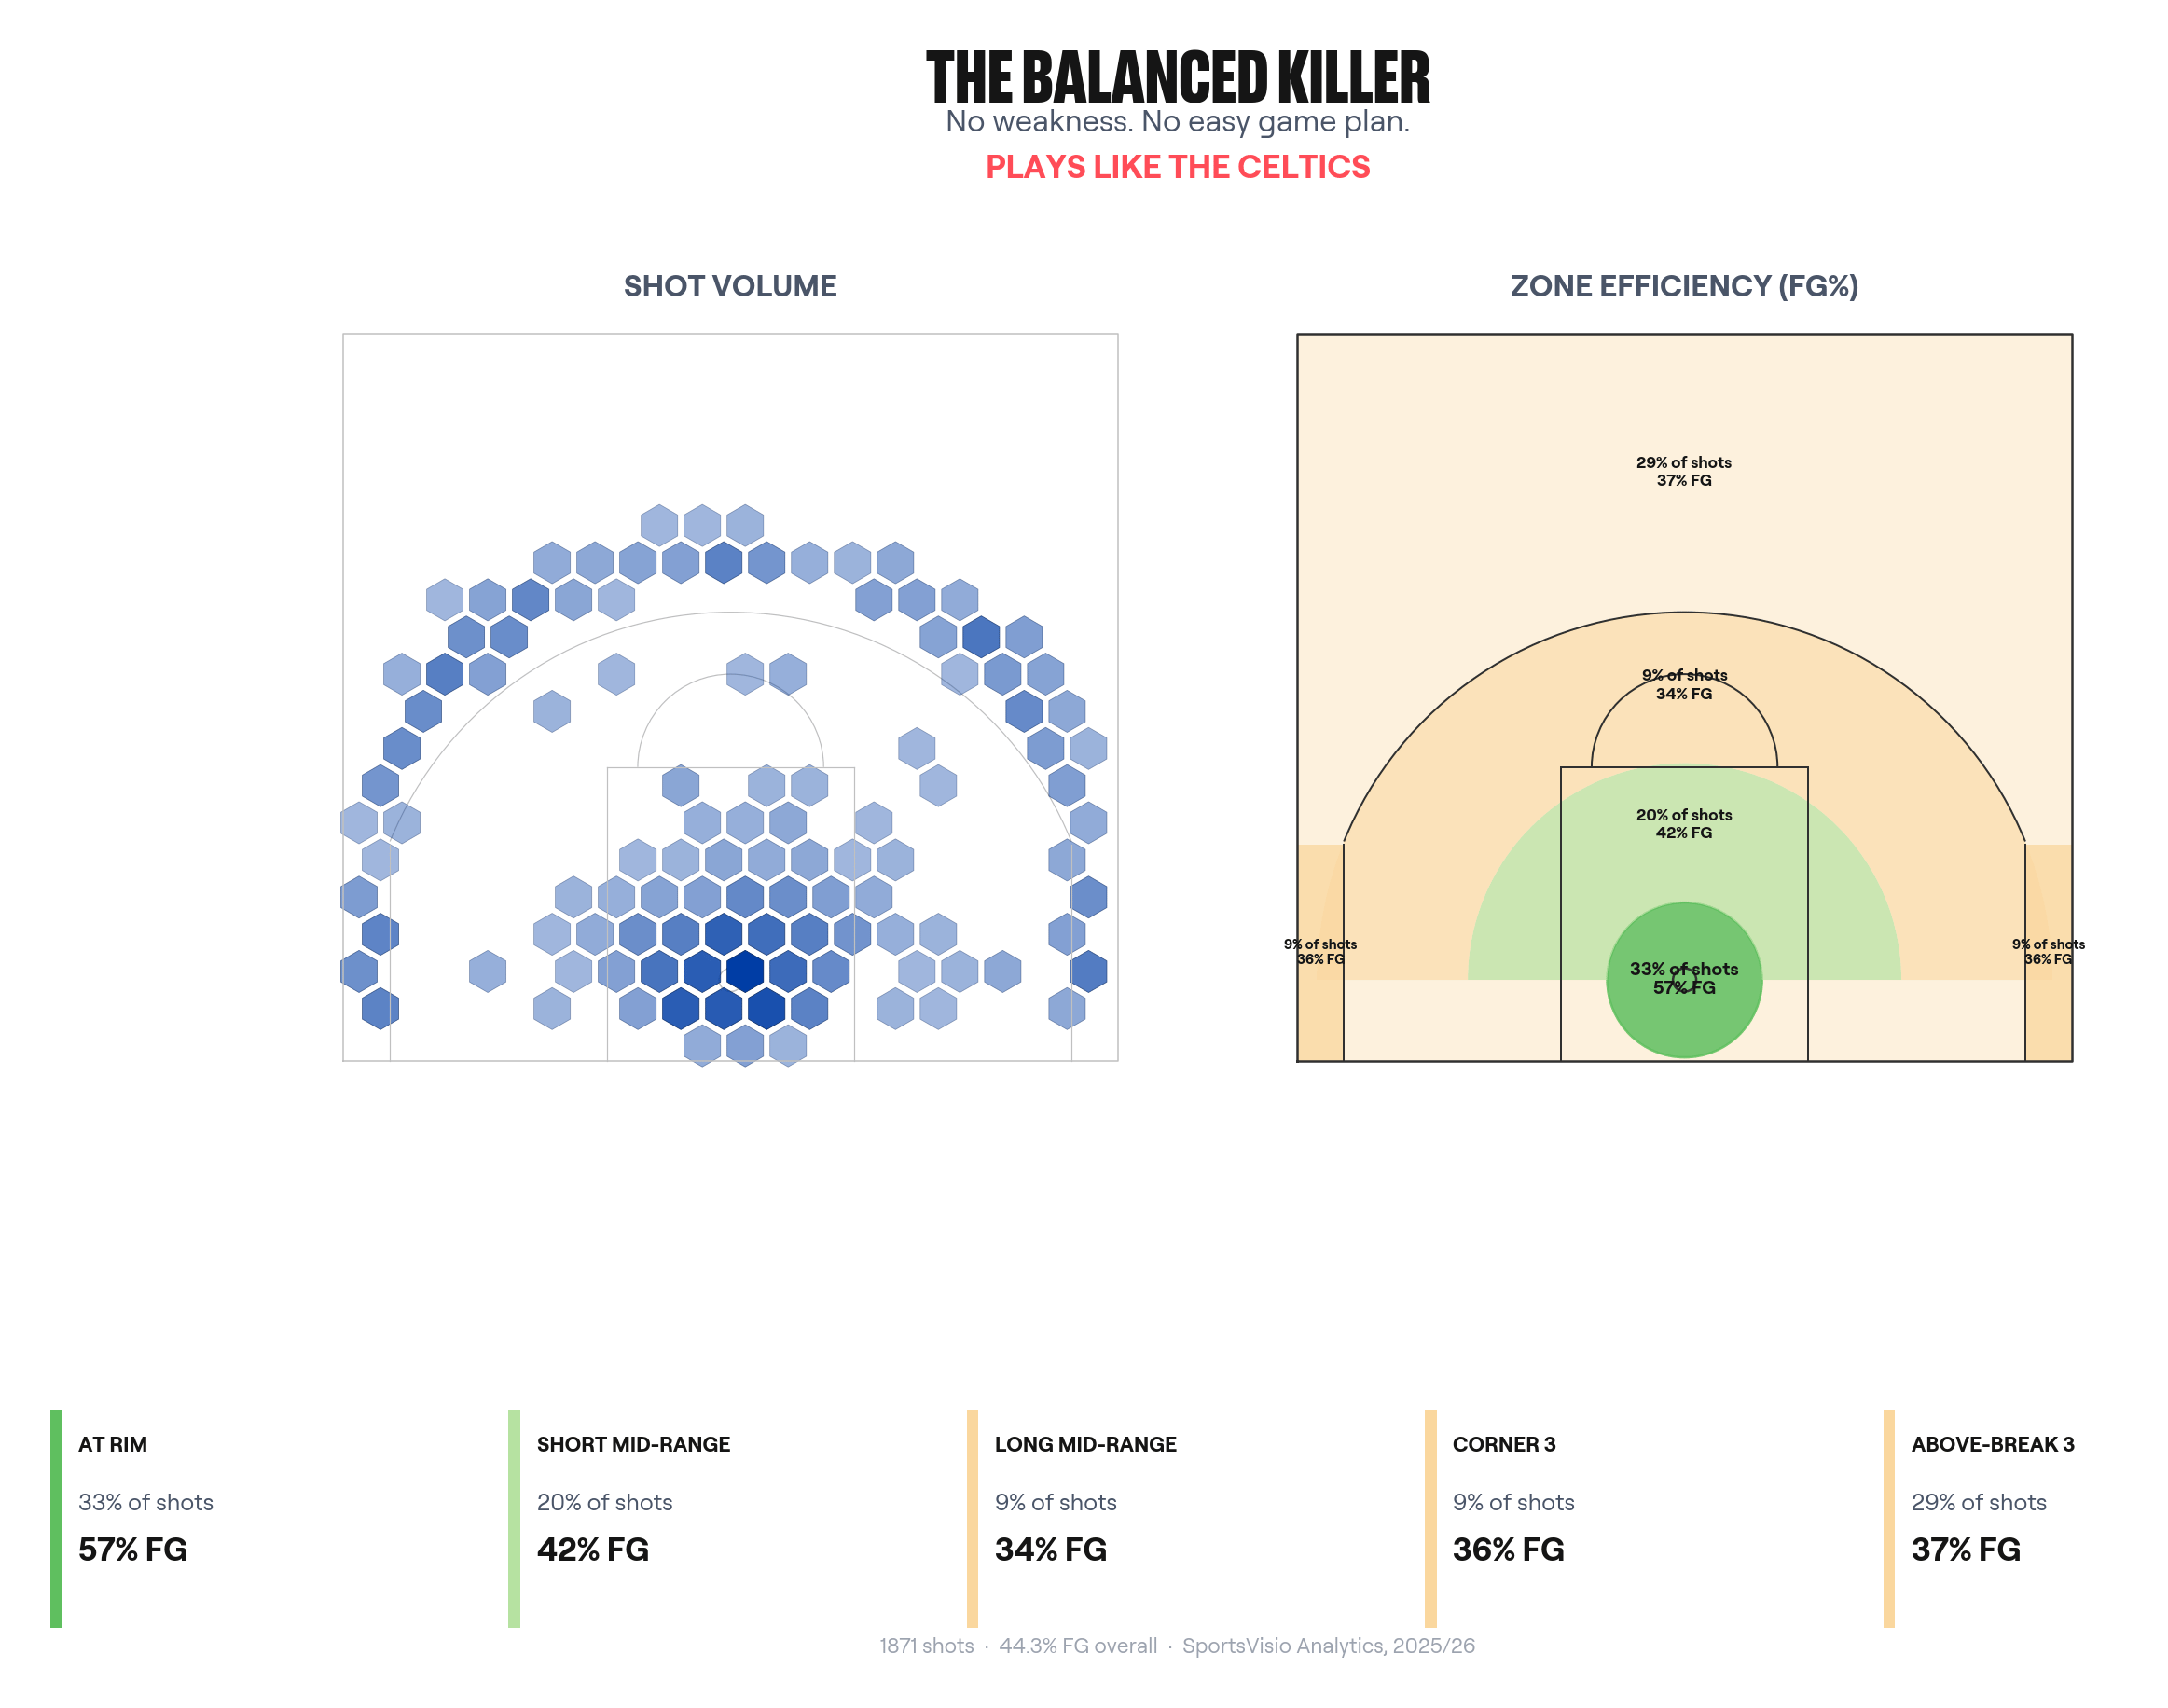
3. The Balanced Killer
What it looks like: Roughly even split — paint, mid-range, three. No obvious hole.
How they win: They're the hardest team to scheme against because there's no weakness to sell out on.
How they lose: Rarely. Usually, it is to a hot Sniper team or an exceptional defense.
NBA analog: Boston Celtics, Denver Nuggets.
Real example: One senior team shot 44.3% overall — the most efficient in its league — and did it with balanced volume across the floor. When you're good from everywhere, defenses run out of answers.
4. The Volume Shooter
What it looks like: High total attempts. Pace-driven offense. Average efficiency.
How they win: Tempo and attrition. They shoot you into submission.
How they lose: Against half-court teams that slow the game down.
NBA analog: Golden State Warriors (2022-24 era), Indiana Pacers.
Real example: One women's team put up 847 three-point attempts — more than any other team in their league. They're committing to volume at scale. When they're on, nobody outruns them.

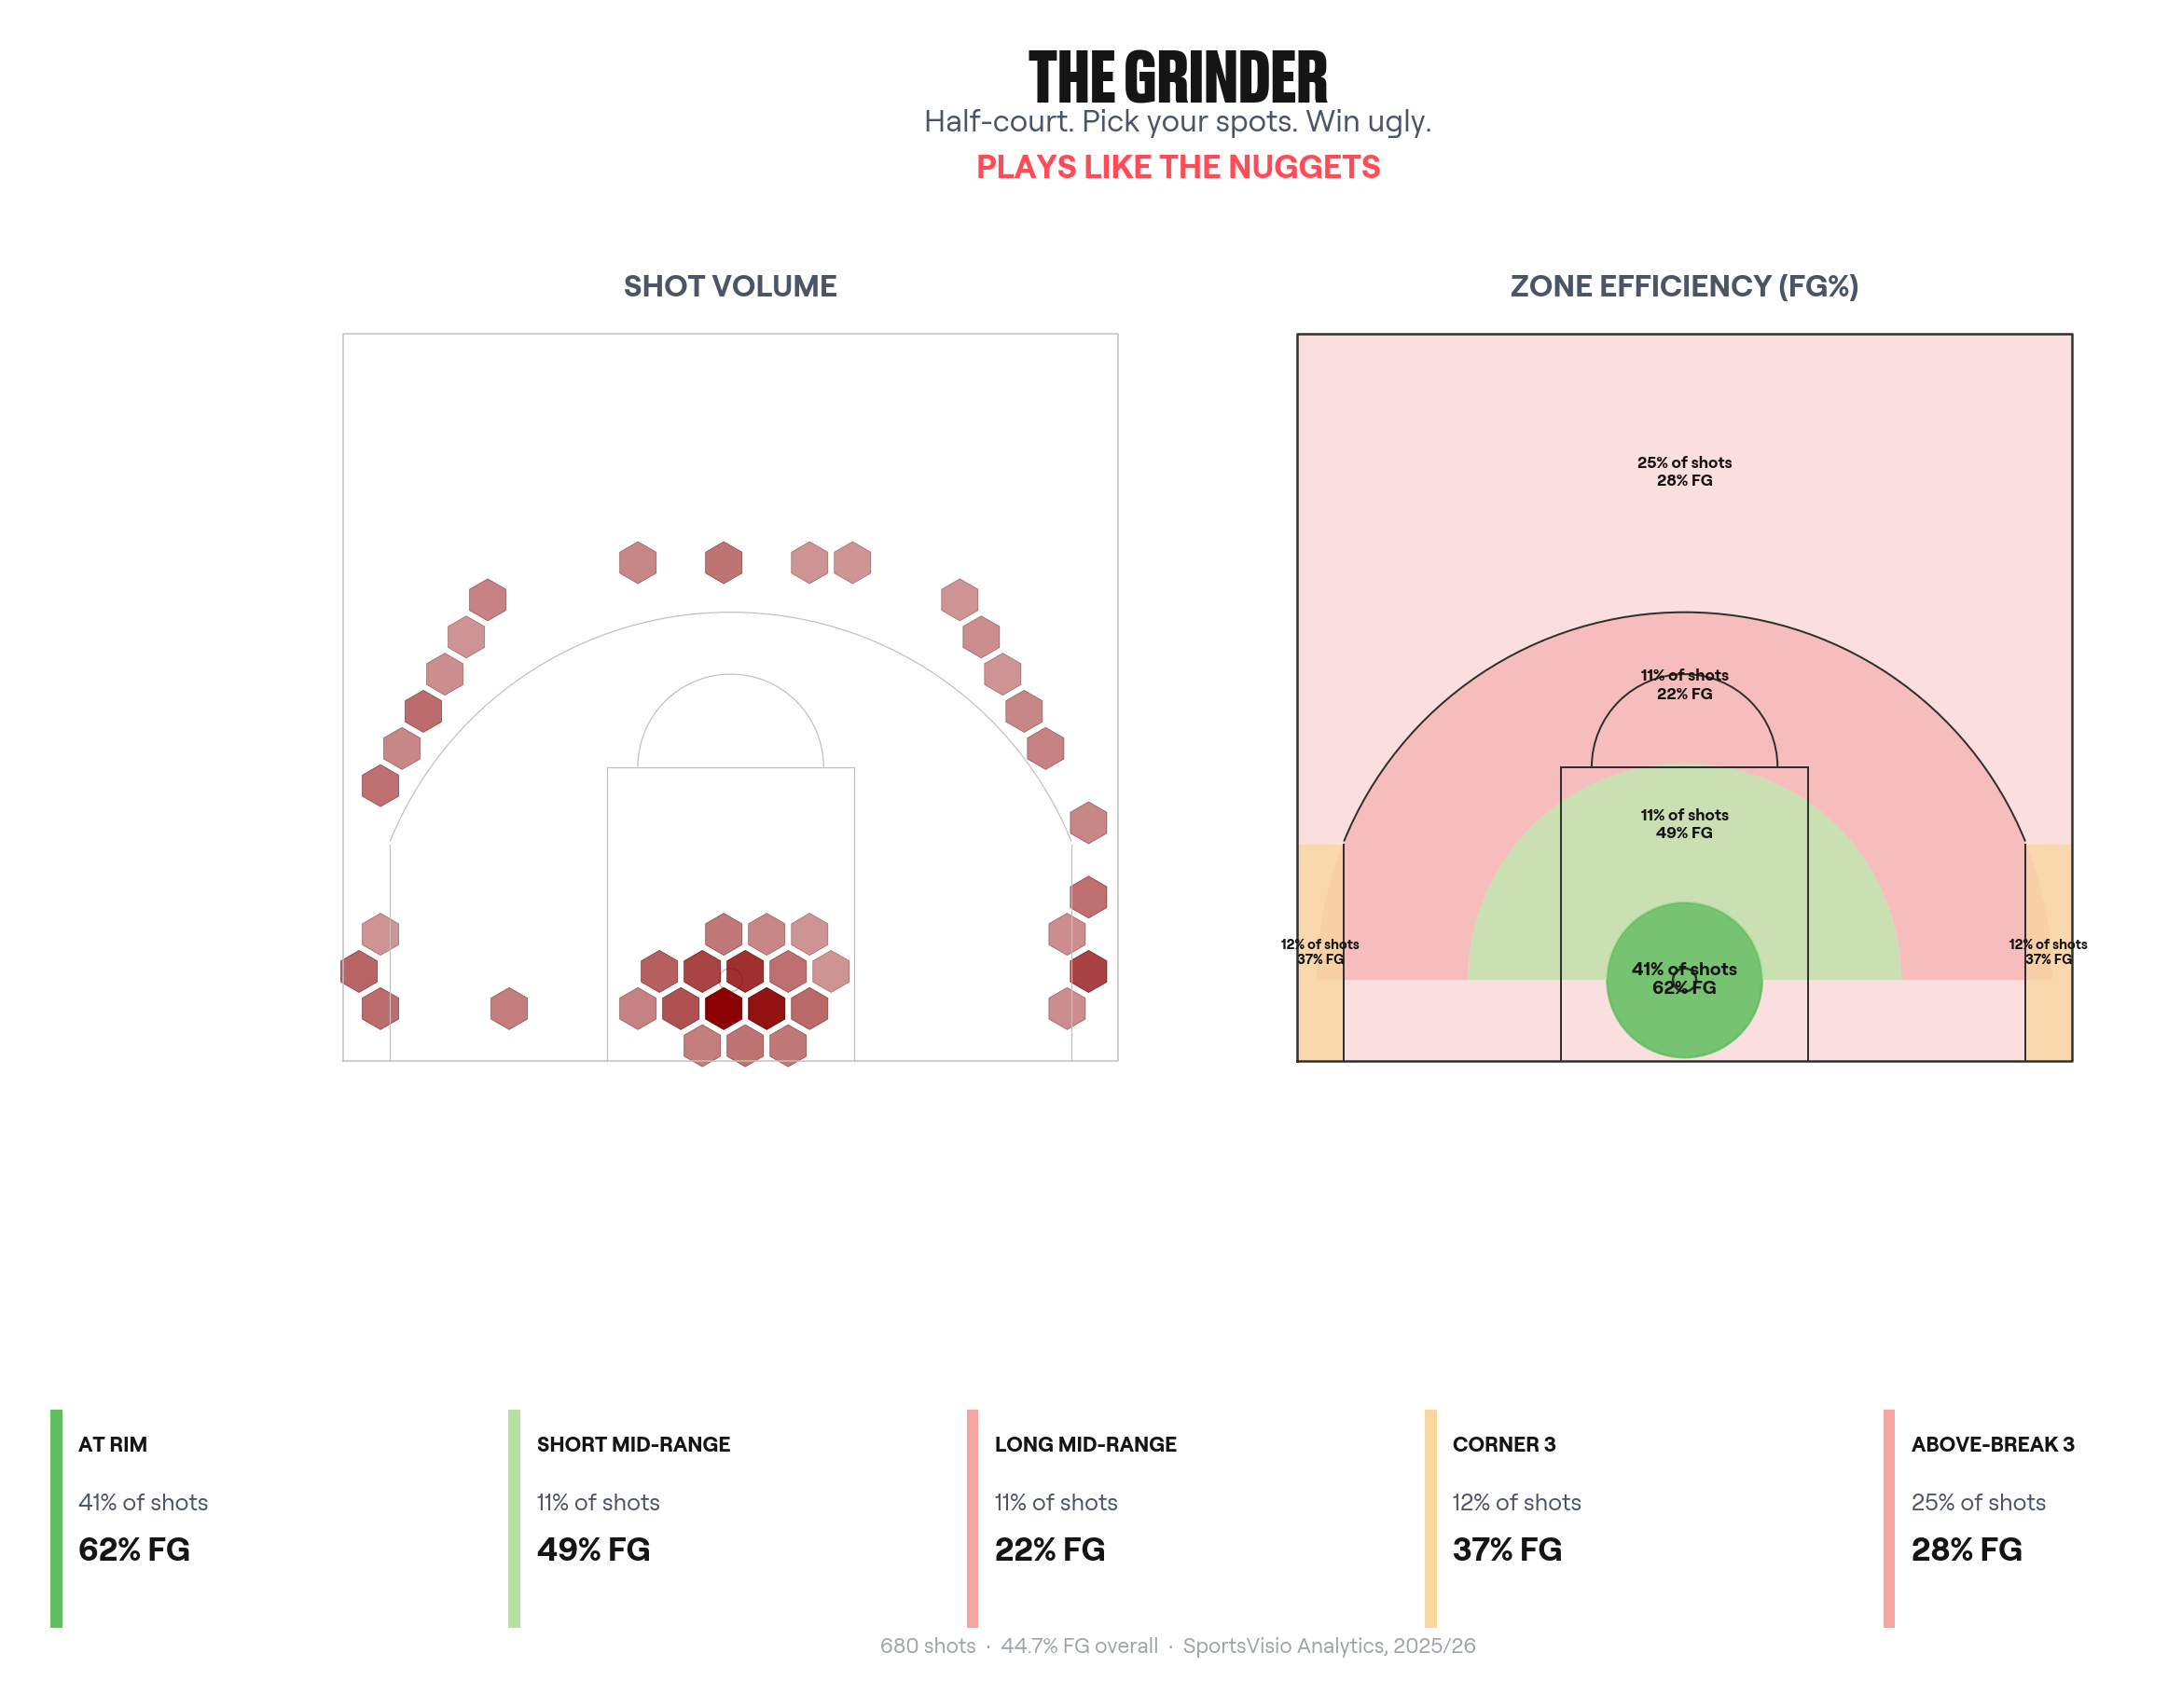
5. The Grinder
What it looks like: Low-to-medium volume, rim-heavy, low three-point rate. High efficiency in the zones they pick.
How they win: Defense. Half-court execution. Ugly games.
How they lose: When forced to play faster than they want to.
NBA analog: 2024 Nuggets, any Tom Thibodeau team.
Real example: One senior side shot 43% from within 10 feet on 46% of their total attempts — the most rim-reliant team in their division. They chose one battle and won it.
Three Truths
Across nearly 60 thousand shots, three things held true everywhere we looked.
1. The mid-range is dead.
Less than 18% of all shots in our sample came from the 10-22 ft range. This is the same trend the NBA has been living with for a decade, since the Rockets went all-in on analytics. It's now bled into every level of the game. If your shot chart shows a mid-range heat zone, you're either a 2012 throwback or you're taking bad shots.
2. The arc is still the biggest bet in basketball.
37% of all shots now come from three. Efficiency (28.7% in our sample) tells you it's still a hard shot. Volume tells you everyone's committed anyway. The math works — 3 × 0.287 = 0.861 points per shot from three vs. 2 × 0.40 = 0.80 from two.
3. Paint volume leads to wins.
The best teams in our sample didn't necessarily finish better at the rim, they just got there more often. More paint touches = more fouls, more offensive boards, more kick-outs. The battle is real estate, not conversion.
How to read your own shot charts
Print this and tape it to your clipboard.
Find your archetype. Look at where the majority of your shots come from. Paint? Arc? Everywhere? Now you know what kind of team you are.
Find your green zones. Where are you above league-average efficiency? Take more shots from there.
Find your red zones. Where are you below league-average efficiency? Take fewer shots from there (or work on them — but honestly, take fewer).
Find your contradictions. A high-volume cold zone is the #1 thing to fix. Most teams have at least one.
Compare game to game. A shot chart from a single game is noise. The pattern across 10 games is the signal.
Most coaches know where their offense wants to score. The shot chart tells you where it actually scores. Those are often different maps.
We love the nitty-gritties!
Jaja Davis plays pro ball overseas. He's a detail guy.

"I like when I can look up a game that I've had and I really want to study what I did wrong or where I can be more effective. SportsVisio gets down to the nitty-gritties and the details."
That's the loop every great player runs whether its pro, college, youth. Play the game. Read your film and your chart. Fix one thing next week.
Coming this Summer
Everything Above, Automatic.
Shot signatures. Zone efficiency. Per-player heat maps. Archetype classification.
We're putting it all together. Every chart, for every shot, for every player.
Keep hoopin’. We’re watching.
Sean